The world runs on data. It has contributed to some of the most significant innovations in the last decade, with AI and machine learning at the forefront. From fears of users developing feelings for ChatGPT to luxury retailers like Michael Kors deploying AI virtual assistants, data is the lifeblood of the digital AI-oriented world we live in.
If you're looking to harness the potential for AI and machine learning in your business, you must first ensure that your data is in the correct format. This is where data normalization comes in. Loosely defined, it is the process of transforming numerical and text data into a standard format that can help improve the accuracy of a machine-learning model.
With this in mind, today's article will explore:
- Data normalization and why it's important
- Common data normalization techniques
- How to apply these techniques in Python
Keep reading below for more insights.
What Is Data Normalization?
Data normalization is one of the most important steps in data preprocessing. Without it, getting insights from any information becomes difficult, especially when working with varied datasets.
For example, if you're comparing the performance of students in a class across different subjects and these subjects have varying grading scales, you may use data normalization techniques to convert the grades into a similar scale for easier comparison.
Take an example of math, science, English, and history with the following grading scales:
- Math: 0 to 100
- English: 0 to 50
- Science: 0 to 80
- History: 0 to 30
A student scores the following:
- Math: 80
- English: 35
- Science: 50
- History: 20
At first glance, it might seem that math is way more critical than history because these subjects use different grading systems. Comparing a student's performance in the current data format can be quite complicated. However, data normalization can make it easier by rescaling these scores to a standard range, typically from 0 to 1 or -1 to 1.
First, let's prepare this data for normalization by getting the percentage score for each subject:
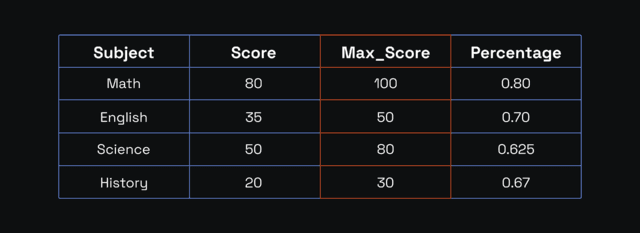
The maximum percentage is 0.80 (math), and the minimum is 0.625 (science).
One of the simplest ways to normalize data is through simple feature scaling, also known as Min-Max Scaling. This technique divides each value by the maximum value for that feature. We'll use it to manually normalize the performance data above. Here is the formula:
Normalized Value = (X - X_min) / (X_max - X_min)
Where:
- X is the original value.
- X_min is the minimum value of the feature in the dataset.
- X_max is the maximum value of the feature in the dataset.
We can normalize this data as follows:
- Math:
Normalized Value = (0.80- 0.625) / (0.80- 0.625) = 1.000
- English:
Normalized Value = (0.70- 0.625) / (0.80- 0.625) = 0.429
- Science:
Normalized Value = (0.625- 0,625) / (0.80 - 0.625) = 0.000
- History:
Normalized Value = (0.67- 0.625) / (0.80 - 0.625) = 0.257
Now you have:
- Math: 1.00
- English: 0.429
- Science: 0.000
- History: 0.257
The performance is now at a standard scale. Drawing insights from this data, such as the subject that was best and least performed, is easier. And this is what data normalization seeks to achieve.
Why Data Normalization Is Important
Data normalization is important when preprocessing data for algorithms and machine learning models. To understand why, let's look at our previous school performance example. Bringing up the values:
- Math: 80
- English: 35
- Science: 50
- History: 20
Suppose we want to use this data to train a machine learning algorithm. Feeding these data points into the system in their current format can cause various problems down the road. To explain why, we will offer a broad, general explanation without delving too much into the intricate details.
Think of the machine learning process as a system of different-sized hills; the lowest point possible represents the lowest error, while the highest peak represents the highest error. Naturally, the algorithm aims to get to the lowest point possible.
Most modern AI models, especially those that utilize neural networks, function by iteratively adjusting the model parameters. At each iteration, the algorithm adjusts the parameters in a direction that takes it to the lowest point possible.
Some hills, like math, with a score of 80, are big hills, while some, like history, with a score of 20, are small hills. They are all equally important, but the algorithm doesn't know this since it processes data in its raw form. As a result, it may focus more on the big hills, neglecting the small hills, which can lead to biased and inaccurate predictions.
This is why data normalization is important. It levels the hills, ensuring none is seemingly more important than the other. In this way, the model can take balanced and accurate steps toward the lowest point possible, otherwise known as convergence.
In short, normalization data analysis methods ensure AI models don't focus on any one feature just because it has a bigger range. By normalizing your data on a standard scale, the algorithm will consider each data point equally, helping it reach convergence faster and more accurately.
Understanding Data Normalization in Python
We're now at the crux of our discussion, where we'll show you how to normalize data in Python. But before we get to that, why the Python programming language? There are many languages; what makes this one suitable for normalizing data? Keep reading below to find out.
Robust Data Normalization Libraries
One of the primary reasons to use Python to normalize your data is the rich ecosystem of libraries this platform offers. They include
- Pandas
Use this library for its wide array of data analysis and structuring tools.
- Scikit-learn
This is a comprehensive library that includes prebuilt functions for normalization, such as MinMaxScaler and StandardScaler.
- NumPy
This library supports working with arrays and matrices, making it useful for custom normalization tasks.
Easy-to-Use Syntax
Python, as a programming language, has a fluid syntax that makes it easy to read and understand code. With strong community support, code maintenance, and debugging are also relatively straightforward, with many free resources available online.
Integration With Machine Learning Frameworks
Python seamlessly integrates with popular machine learning frameworks such as Tensorflow and PyTorch. This naturally makes it the language of choice for normalizing input data for machine learning models.
Now that you understand the versatility of this programming language, you may be wondering how to normalize data in Python. Don’t worry—we’ve got you covered. Keep reading to find out more:
How to Normalize Data in Python
Below is a rundown of the different techniques for normalizing data in Python:
Min-Max Scaling
Remember the formula we used to normalize our student score results? It's known as Min-Max Scaling because it takes the minimum and maximum values of a given dataset and uses them to compute the normalized value. Going back to our previous example:
- Math: 80 out of 100
- English: 35 out of 50
- Science: 50 out of 80
- History: 20 out of 30
Let us normalize this data using Min-Max Scaling in Python. Run the following code in your editor of choice with all the prerequisites installed:
from sklearn.preprocessing import MinMaxScaler
import pandas as pd

# Original data

data = {
  'Subject': ['Math', 'English', 'Science', 'History'],
  'Score': [80, 35, 50, 20],
  'Max_Score': [100, 50, 80, 30]
}

# Convert to DataFrame
df = pd.DataFrame(data)

# Calculate the percentage score
df['Percentage'] = df['Score'] / df['Max_Score']

# Initialize the MinMaxScaler
scaler = MinMaxScaler()

# Fit and transform the percentage scores
df['Normalized'] = scaler.fit_transform(df[['Percentage']])

# Display the normalized data
print(df[['Subject', 'Normalized']])
This is the response you'll get:
Subject Normalized
0 Math 1.000000
1 English 0.428571
2 Science 0.000000
3 History 0.238095
Notice that the results are similar to the normalized values we calculated manually. This process is much faster and can save you a lot of time when working with large datasets.
Z-Score Scaling
While the min-max method uses the minimum and maximum values in a given data set for normalization, the Z-Score scaling method centers normalized data around the standard deviation, ensuring that each feature contributes equally to the model. Here is the formula:
Z = (X - μ) / σ
Where:
- Z is the Z-score (standardized value).
- X is the original value.
- μ (mu) is the mean of the feature.
- σ (sigma) is the standard deviation of the feature.
Instead of spending time calculating manually, especially for large datasets, you can use Python to normalize data using Z-score scaling. Applying our previous example, here is the code you should use:
from sklearn.preprocessing import StandardScaler

import pandas as pd
# Original data

data = {
    'Subject': ['Math', 'English', 'Science', 'History'],
    'Score': [80, 35, 50, 20]
}

# Convert to DataFrame
df = pd.DataFrame(data)

# Initialize the StandardScaler
scaler = StandardScaler()

# Fit and transform the data
df['Z-Score'] = scaler.fit_transform(df[['Score']])

# Display the standardized data
print(df[['Subject', 'Z-Score']])
This is the response you should get:
Subject Z-Score
0 Math 1.095445
1 English -0.297076
2 Science 0.000000
3 History -0.798369
Now, if you're wondering why the results differ, it's because we used a different approach. The Z-score measures the number of standard deviations a value is from the mean.
For example, Science, which had the lowest score, is 0 standard deviations from the mean, while Math, the highest-scoring subject, is 1.095 standard deviations from the mean. As you can see, the interpretation of the data remains consistent across the two techniques discussed.
MaxAbs Scaling
This data normalization technique is useful for datasets with positive and negative values. It helps normalize the data within a specific range, typically from -1 to 1, by dividing each feature by its maximum absolute value using this formula:
X_scaled = X / max(|X|)
Where:
- X_scaled is the scaled value of the feature.
- X is the original value of the feature.
- max(|X|) is the maximum absolute value of the feature.
We're going to use a different example to show you how this method works. Consider a dataset with the following values:
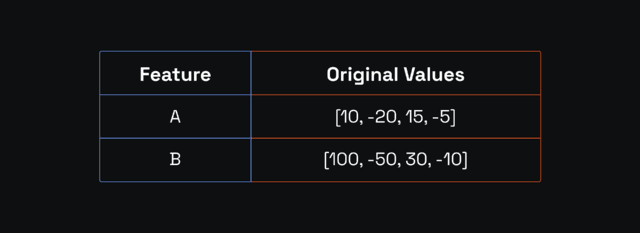
We'll use the following Python code to get the normalized values using the MaxAbsScaler for feature A:
from sklearn.preprocessing import MaxAbsScaler

import pandas as pd
# Original data

data = {'Feature': [10, -20, 15, -5]}
df = pd.DataFrame(data)

# Initialize the MaxAbsScaler
scaler = MaxAbsScaler()

# Fit and transform the data
df['Scaled'] = scaler.fit_transform(df[['Feature']])

# Display the scaled data
print(df[['Feature', 'Scaled']])
This is the result you should get:
Feature Scaled
0 10 0.50
1 -20 -1.00
2 15 0.75
3 -5 -0.25
We now have a standard range from -1 to 0.5, which is much easier for an algorithm to interpret.
Decimal Scaling
This technique is suitable for datasets with varied decimal points. It normalizes data by moving the decimal point depending on the absolute value of the feature. Here is the formula:
X_scaled = X / 10^j
Where:
- X_scaled is the scaled value of the feature.
- X is the original value of the feature.
- 10^j is 10 raised to the power of j, which is determined based on the maximum value of the feature.
Let's normalize the following dataset using decimal scaling in Python:
- Values: 0.345, -1.789, 2.456, -0.678
Here is the code:
import pandas as pd

# Original data with decimal points
data = {
   'Feature': [0.345, -1.789, 2.456, -0.678]
}

df = pd.DataFrame(data)

# Find the maximum absolute value in the dataset
max_abs_value = df['Feature'].abs().max()
# Determine the scaling factor
import math

# Find the smallest power of 10 greater than the maximum absolute value
scaling_factor = 10 ** math.ceil(math.log10(max_abs_value))

# Apply Decimal Scaling
df['Scaled'] = df['Feature'] / scaling_factor

# Display the original and scaled data
print(df)
This is the result:
Feature Scaled
0 0.345 0.0345
1 -1.789 -0.1789
2 2.456 0.2456
3 -0.678 -0.0678
How to Normalize Text Data in Python
As you perform data analysis and preparation for your machine learning model, you may also have to normalize text data. Unlike numerical values, normalizing text data typically includes lowercasing, removing punctuation, and tokenization. For example, you may have to split individual text into units called tokens, which can be phrases or symbols. Say we wanted to split this text:
"Tokenization splits texts into words."
Use the following code to normalize this text data:
import nltk

from nltk.tokenize import word_tokenize

# Download the necessary NLTK resource
nltk.download('punkt')

# Sample text
text = "Tokenization splits text into words."

# Tokenize the text
tokens = word_tokenize(text)

# Display the tokens
print(tokens)

The tokenized text should be as follows:
['Tokenization', 'splits', 'text', 'into', 'words', '.']
Conclusion
We have come to the end of our discussion on data normalization methods. This process is essential for preparing input data for machine learning models. While you can manually normalize data, it's impractical for large datasets.
Python is preferred because it has comprehensive libraries, a clean fluid syntax, and it's open source. The methods we've discussed include Min-Max, Decimal, and Z-Score Scaling. Now, you can train your machine learning models with greater accuracy!
FAQ
What is the difference between scaling and normalization?
While both are common data preprocessing techniques, there's a subtle difference between them. Normalization attempts to adjust the range of values by fitting them into a specific range, whereas scaling attempts to adjust a range of feature values without necessarily fitting them into a specific range.
What is the difference between standardization and normalization?
Standardization transforms data to have a mean of zero and a standard deviation of one without binding it to a specific range. Normalization rescales data to fit within a specific range, say [0,1] or [-1,1].
What is the difference between normalized data and denormalized data?
Normalized data has been transformed to fit within a specific range as part of machine learning data preprocessing. On the other hand, denormalized data has been reverted back to its original form.